

Benchmark with AI (pt3/3): How I actually use AI for platform evaluation
AI agents are useful for platform evaluation when execution is delegated carefully and judgment stays with the human.

The right mental model
TL; DR: Use agents for research, boilerplate, and benchmark execution. Keep methodology design and result interpretation for yourself; those require judgment the tools can't encode.
After cataloging how agents fail and building the tools that prevent it, I should be clear: I use AI coding agents for platform evaluation every day. They're very useful for specific tasks. The previous posts aren't arguments against using agents but for using them correctly.
The right mental model: an AI agent is a tireless research assistant with excellent reading comprehension, infinite patience, and zero domain judgment. It will read every page of documentation you point it at, generate any boilerplate you describe, and format results beautifully; and it will just as confidently execute any methodology you give it, valid or not, without questioning whether the methodology makes sense.
The human handles methodology and interpretation while the agent handles execution and comparison. When those roles get confused; when the agent designs the methodology or the human accepts results they haven't validated; the output is unreliable.
Here's the key insight that took me a while to internalize: the division isn't "human does hard things, agent does easy things." Some of what agents do well is hard (synthesizing documentation across 15 platform pages, for instance). And some of what humans must do is simple (choosing a scale factor appropriate for your hardware). The division is: humans make judgment calls, agents execute defined procedures. Judgment is about context, trade-offs, and "what matters here," while execution is about doing the defined thing correctly and completely.
Where agents excel
I'm not going to be coy about this: AI agents are very good at several parts of platform evaluation. Here's where I rely on them heavily.
Platform discovery and feature comparison
This is the single highest-value use case. When evaluating a new database platform, I need to understand: What data formats does it support? What SQL dialect? What indexing options? What's the concurrency model? What are the scaling limits? How does pricing work?
Gathering this from documentation used to take me the better part of a day per platform. With an AI agent, it's a 20-minute conversation. "Read the ClickHouse documentation and summarize: supported data types, indexing mechanisms, replication model, and known limitations for analytical workloads." For a first pass, the summaries are usually accurate enough because this is reading comprehension, not judgment, and they're often more thorough than my manual scan would be, because the agent doesn't get bored on page 47 of the docs.
For building an initial feature matrix across 5 platforms, agents save me 3-4 days of documentation grinding with higher coverage. I still verify specific claims that seem surprising or that I'll rely on for decisions. But the first pass is agent territory.
Boilerplate generation
Connection setup, schema creation, driver configuration, environment scripts, Docker Compose files for multi-platform testing, all mechanical and well-defined. An agent producing a DuckDB connection class or a PostgreSQL schema from the TPC-H specification is doing translation work, not judgment work. The output is either correct (matches the spec) or incorrect (doesn't match), and correctness is easily verified.
Result formatting and documentation
After a BenchBox run produces raw timing data, the mechanical work of formatting it into comparison tables, calculating QphH@Size, computing percentage differences, and generating markdown summaries is tedious and error-prone when done manually. I give the agent raw CSV output and ask for a formatted comparison table. When the input is clean BenchBox output, the arithmetic is usually reliable and the formatting is cleaner than my manual first pass. This saves 30-60 minutes per benchmark report.
Cross-platform syntax translation
"Translate this PostgreSQL query to ClickHouse SQL, noting any semantic differences in how window functions or date arithmetic work." Agents often catch subtle dialect differences, INTERVAL syntax, type casting semantics, and NULL handling variations that I'd miss on a manual first pass. This is linguistic pattern matching, a bounded task they usually handle well.
Exploratory queries and environment setup
"What happens if I run this query with a hash join hint vs. a merge join hint?" Agents are useful for generating query variants, executing them, and reporting differences. This is exploration, not measurement, so the numbers don't need to be publication-quality. Similarly, "set up a DuckDB instance with the TPC-H extension, generate SF-1 data, verify all tables loaded correctly" is a defined procedure with clear success criteria that agents usually handle well when I verify the output.
Where human judgment is irreplaceable
Here's the flip side, the tasks where delegating to an agent produces confident-sounding garbage.
Methodology design
"What should I measure, and how?" This is the fundamental question of any evaluation, and it has no universal answer. It depends on your workload, your scale, your budget, your team's expertise, and your existing infrastructure.
An agent asked "what benchmark should I run to evaluate DuckDB vs. PostgreSQL for my use case?" will give you an answer, usually "TPC-H," but it can't know whether your workload is actually decision-support, whether your data volumes match any standard scale factor, or whether concurrency testing matters for your deployment.
I design methodology myself, every time. Here's what happens when I don't:
Me: I need to evaluate Snowflake vs. a local DuckDB instance for
    a warehouse-scale analytics workload. What scale factor should I use?

Agent: For a meaningful comparison, I recommend SF-1. This provides
       enough data to exercise the query engine while keeping
       execution times reasonable for iterative testing.
SF-1 is roughly 1GB of data4. On Snowflake, or any distributed system with 128GB of RAM per node, SF-1 often fits entirely in memory on a single node - the distribution mechanism is never exercised. On the DuckDB side, it also understates the scale if the real question is "what happens at warehouse size?" You'd need much larger scale factors before the workload actually stresses the system in a meaningful way. The agent defaulted to "reasonable for testing" when I needed "meaningful for production evaluation."
Result interpretation
"DuckDB is 2.3x faster than PostgreSQL on TPC-H Q6 at SF10." What does this mean for your production decision? Nothing, yet. Is Q6 representative of your workload? Does SF10 match your data volume? Was PostgreSQL tuned? Does the gap hold at higher concurrency?
Agents will confidently recommend platforms that are wrong for the stated requirements. I've collected these examples:
Me: Recommend a database for concurrent-write analytics.
    Multiple users updating dashboards simultaneously.

Agent: DuckDB would be excellent for this. It's optimized for
       analytical queries and has a simple deployment model.
DuckDB allows multiple readers, but writing from multiple processes to the same database file isn't supported; only one process can read/write at a time2. The agent matched "analytics" to DuckDB without understanding the architectural constraint.
Me: I need to analyze 50MB of CSV files on my laptop.

Agent: Snowflake offers excellent performance for analytical
       workloads with minimal setup. Their free trial...
Snowflake's XS warehouse bills 1 credit per hour1. The dollar price per credit varies by edition and region, so the absolute cost depends on your account and cloud. For 50MB of data that DuckDB handles in milliseconds for free, the agent recommended a cloud service because it pattern-matched "analytics" without considering scale appropriateness.
Result interpretation requires domain expertise and business context intersecting simultaneously, and no tool or template replaces that.
Platform-specific tuning decisions
How much should I tune each platform? Default settings produce an "out of box" comparison that's easy to reproduce but potentially unfair to well-tuned platforms. Aggressive tuning produces better numbers but introduces expertise-dependence.
"How fast is Platform X if I invest a week in tuning?" is a completely different question from "How fast is Platform X with my team's current expertise?" Both are valid. Choosing between them requires understanding your audience and purpose, judgment that agents can't provide because they don't know your team.
Validity assessment
"Are these results actually measuring what I think?" A benchmark that runs 10x faster than expected might mean: the platform is excellent, the data didn't load correctly, a query used a cached result, the scale factor was too small, or a query hit an optimization that won't apply to real data. Distinguishing between these requires understanding what's plausible for the platform's architecture and the specific query pattern.
The workflow I actually use
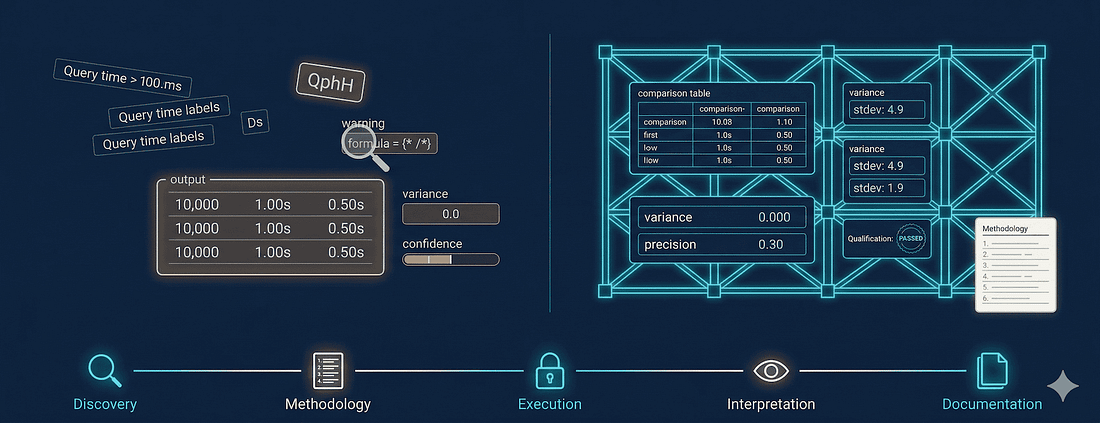
Here's the five-phase workflow I've refined over a year of AI-assisted platform evaluation with BenchBox. Each phase has a clear human/agent division.
Discovery: Agent reads docs and produces feature comparison tables. I define the candidate list, verify surprising claims, and eliminate deal-breakers. Output: shortlist of 2-4 platforms.
Methodology: No agent involvement. I choose benchmarks, scale factors, tuning level, success criteria, and run protocol. Output: a methodology document specifying exactly what to run and how.
Execution: Agent runs benchmarks via BenchBox MCP. Data generation, qualification, warm-up, substitution parameter rotation, and metric calculation are all handled automatically. The agent can't skip steps because the tool doesn't expose "skip qualification" as an option. I review qualification results and check for anomalies.
Interpretation: Agent formats comparison tables and calculates per-query differences. I interpret results in context (is the winner right for my workload?), assess methodology, identify follow-up questions, and make the recommendation.
Documentation: Agent drafts report structure with data tables and reproducibility section. I write the analysis, verify claims match the data, and add caveats the agent wouldn't know to include.
The detection paradox
The uncomfortable truth behind everything I just described: users delegate benchmark tasks to AI agents because they lack benchmark expertise. But detecting invalid agent output requires benchmark expertise.
This creates a circular dependency. If you knew enough about TPC-H methodology to catch the agent's mistakes, you probably wouldn't need the agent to run the benchmark. If you don't know enough, you can't catch the mistakes. The knowledge gap that makes delegation attractive is the same gap that makes validation impossible; which is exactly why tool-level constraints matter more than user-level expertise.
The SSB test from When AI agents are confident and wrong demonstrates the failure mode directly. That post includes the original prompts, generated scripts, and the methodology breakdown. Both agents would have submitted their results without flagging a single methodology issue. Claude Opus's 679-line script would have printed timing tables for a workload built from random data. Codex's would have reported elapsed milliseconds with no composite metric. If either had been used for a platform decision, the decision would have rested on numbers that measured nothing; and nothing in the output would have indicated that.
The fundamental issue: detection requires the expertise users don't have, presented in a format that conceals the absence of that expertise.
A taxonomy of plausible garbage
Not all garbage looks the same. Understanding the categories helps explain why detection is so difficult, and what to look for.
Structurally plausible
The format is correct but the content isn't.
Example: A report labeled "QphH@10: 42,150" where the number was calculated as arithmetic mean of elapsed times instead of geometric mean of per-query throughput scaled to hourly rate.
The label matches what you'd expect. The number has the right magnitude. But the calculation is wrong, and the result isn't comparable to any other TPC-H benchmark. You'd need to know the QphH formula to recognize the error. Most users don't.
Numerically plausible
The numbers are in reasonable ranges, but they don't measure what they claim to measure.
Example: Query times from random data masquerading as TPC-H times. Q6 reports 0.089 seconds instead of 0.34 seconds because the random data produced different selectivity, executing against fewer rows.
If you see a time like 0.089 seconds for Q6 at SF-10, that's a red flag. It might be real elapsed time, but it likely reflects the wrong workload because the data distributions are wrong. You'd need to know expected ranges for TPC-H queries at SF-10 to notice that.
Methodologically plausible
The terminology is correct but the procedure is invalid.
Example: A report stating "Qualification: PASSED (22/22 queries validated)" where "validation" meant "returned non-empty results" rather than "matched SF-1 reference answers."
The agent used the right word. Qualification is a real TPC-H concept. But the agent invented a definition that satisfied the linguistic requirement without satisfying the methodological one. You'd need to know what TPC-H qualification actually means.
Comparatively plausible
The rankings match expectations but the magnitudes are fabricated.
Example: A report showing "DuckDB: QphH 42,150 / PostgreSQL: QphH 18,230" where DuckDB really is faster for analytical queries, but neither number was calculated correctly.
The relative ordering is defensible. DuckDB does outperform PostgreSQL on OLAP workloads. An expert might look at this and think "sounds about right." But "sounds about right" isn't "is right." Confirmation bias makes this category dangerous.
Red flags that something went wrong
After a year of this workflow, I've learned to recognize when agent-produced output is noise rather than signal. If you see any of these, stop and investigate before using the results.
Suspiciously round numbers
Real benchmark results are messy; query times like 7-11ms, 9-17ms, 9-13ms across runs. Nothing rounds to a clean number. Compare to what I got from an unconstrained agent:
TPC-H Results (SF-10):
  QphH: 10,000
  Q1: 1.00s | Q2: 0.50s | Q3: 0.75s | Q4: 0.25s | ...
  All queries completed successfully.
Every number is round. The QphH equals the scale factor times 1,000; a formula that doesn't exist in the TPC-H spec. This output was the agent generating plausible-looking data rather than measuring anything.
Results that exactly match expectations
If every platform performs exactly as you predicted; DuckDB wins everything by exactly 2x, PostgreSQL wins nothing; be skeptical. Real benchmarks produce surprises. In my experience, there's always at least one query where the "slower" platform wins, usually due to a specific optimizer behavior or data access pattern.
Other flags from When AI agents are confident and wrong
Missing variance: Single-run timing with no repetition or standard deviation
Scale factor mismatch: SF-1 on a 128GB machine; you're benchmarking RAM, not the query engine
No warm-up or qualification: Straight from data load to timing, skipping both
Identical results across runs: Cache effects or duplicated output rather than independent measurement
Query times that are too fast: Wrong data distributions producing easier workloads
Wrong metric: Elapsed seconds instead of the benchmark's defined composite (QphH@Size, Power@Size)3
Series conclusion
"Be more careful" isn't a solution; users can't detect what they don't have expertise to recognize. The structural fixes from Giving agents knowledge instead of freedom; validated inputs, workflow templates, and structured errors; address the supply side, and that post walks through the tool constraints in detail. But the detection paradox above explains why the demand side matters too: tools need to validate output, not just input. Mandatory methodology metadata and confidence indicators let users assess reliability without becoming benchmarking experts themselves.
AI agents optimize for successful execution, not measurement validity. Everything that looks like success; code that runs, numbers that appear, professional formatting; can be achieved without producing valid measurement.
The workflow that avoids this: use agents for research, boilerplate, formatting, and benchmark execution. Put structured tools between the agent and the results; anything that encodes correct methodology rather than hoping the agent recalls it. And keep the judgment calls for yourself: what to measure, what the numbers mean, what decision they support.
If you take one thing from this series: write the methodology document before the agent touches anything. An agent executing a defined plan produces valid execution, but an agent designing its own methodology produces confident-sounding garbage.
This concludes the "AI Agents and Database Benchmarking" series. For more on BenchBox's methodology and how Oxbow Research uses it for platform evaluation, see the "Introducing Oxbow Research" series.
Footnotes
Overview of Warehouses - Snowflake, accessed 2026-02-02. X-Small (XS) warehouse consumes 1 credit per hour.
Concurrency - DuckDB, accessed 2026-02-02. Only one process can write to a database at a time; multiple readers are supported.
TPC-H Specification v3.0.1 - TPC, accessed 2026-02-02. Clauses 5.4.1-5.4.3 define Power, Throughput, and the composite QphH@Size metric.
TPC-H Specification v3.0.1 - TPC, accessed 2026-02-02. Clause 4.2.5.1 estimates database size by scale factor (SF=1 ~1GB).