

How Much Faster is DuckDB 1.5 vs 1.0? A lot
I benchmarked every DuckDB minor release from 1.0.0 through the 1.5.0 dev build on TPC-H, TPC-DS, ClickBench, and SSB. The results tell a clear story of DuckDB quickly improving.

TL;DR: Is upgrading from DuckDB v1.0.0 worth it? Yes. v1.5.0-dev is 1.67× faster on TPC-H, 1.84× faster on ClickBench, and 1.45× faster on SSB, with a 1.73× higher TPC-DS Power@Size score.
Introduction
This post evaluates the last six DuckDB versions (1.0.0 through 1.5.0-dev) on the TPC-H, TPC-DS, ClickBench, and Star Schema (SSB) benchmarks.
DuckDB is now common infrastructure for SQL analytics work. It runs in-process with no server, handles billion-row workloads on a laptop, and embeds into Python, R, and dozens of other runtimes. Since v1.0.0 shipped in June 2024, it has become a standard tool for data engineering, data science, and ad hoc analytics.
DuckDB is typically embedded in applications, notebooks, and scripts with the version locked to ensure consistent behavior. So it's worth highlighting version-level performance improvements that locked version embeds may be missing out on.
MotherDuck estimated a cumulative 2× improvement since v1.0.01. Because DuckDB is open source, I can easily compare the six major versions since 1.0, at the query level, and trace performance shifts to specific PRs and issues: not just "it's faster," but which execution changes produced which gains.


Versions Tested
I tested the last patch release of each minor version to capture cumulative improvements. For v1.5, I used a pre-release dev build (1.5.0.dev311). DuckDB's release calendar lists 1.5.0 as upcoming on March 2, 2026, and GitHub Releases still shows v1.4.4 as latest GA2.
DuckDB's Performance Evolution
Versions 1.1 through 1.3: Execution Engine, I/O, and Parquet
The first three post-1.0 releases moved from core execution to storage. v1.13 shipped optimizer work (filter and join improvements) and produced the biggest single-version TPC-H jump in this matrix (+39.4% Power@Size). v1.24 focused on I/O (CSV parser rewrite, Parquet bloom filters) and delivered the largest single-version ClickBench drop (17.7% over v1.1). v1.35 rewrote Parquet reader/writer paths (deferred column fetching and stronger pushdown), changes that matter most in Parquet-heavy workloads rather than these in-memory runs.
Version 1.4: Sorting Rewrite
The v1.4^5] sorting rewrite (PR-17584) replaced DuckDB's sort implementation with a K-way merge sort, delivering 1.7-2.7× improvement on random data and up to 10× on pre-sorted data in isolated ORDER BY benchmarks[^8]. TPC-H shows modest gains (+1.4% on my sorting proxy queries) because its ORDER BY operations are one component of multi-join queries, not isolated sorts. DuckDB 1.4 also changed CTE behavior to materialize by default ([PR-17459), with the release notes reporting performance and correctness improvements for repeated CTE references6. In this matrix, TPC-DS Power@Size increased from 614,882 (v1.3.2) to 630,854 (v1.4.4).
Version 1.5.0-dev: Continued Acceleration
After major rewrites in v1.3 and v1.4, v1.5.0-dev shows another round of gains: +4.7% TPC-H Power@Size, +6.1% TPC-DS Power@Size, 0.5% faster ClickBench, and SSB recovering fully from the v1.3/v1.4 regression to become the fastest version (938ms). Because GA release notes aren't final, I focus on observed deltas rather than attributed features. Concurrent upstream work mapped from v1.5-variegata^7] includes join memory improvements ([PR-21022), window optimizer extensions (PR-21021), and plan correctness tightening (PR-21014). These are the most active performance-relevant threads on the branch at test time. The per-query delta table in the TPC-H results section shows where the gains landed.
Results: TPC-H (SF=10)
Overall Version Progression
TPC-H Power@Size, the TPC standard metric for single-stream query performance: 3600 × Scale_Factor / geometric_mean(per-query times). Higher is better. The geometric mean weights all queries equally, so a 2× improvement on any single query contributes the same regardless of absolute runtime.
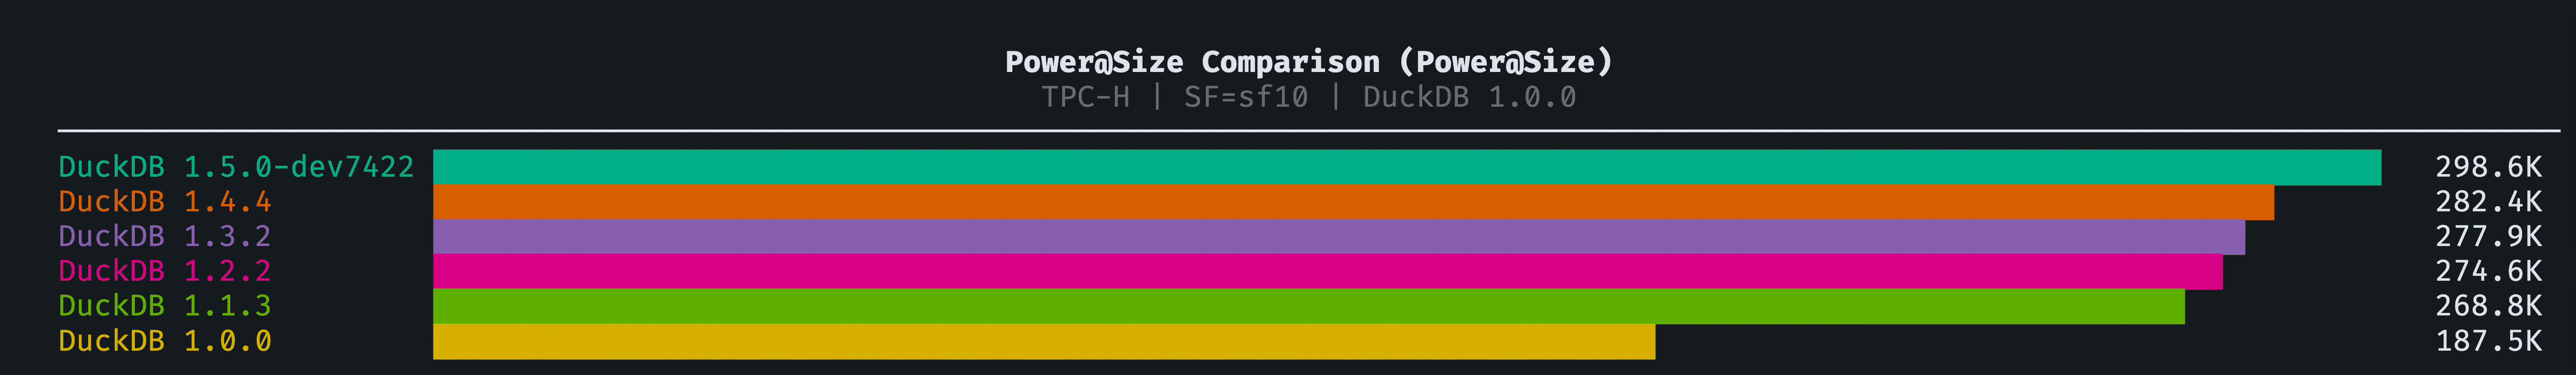
Total Runtime (all 22 queries):
Per-Query Analysis
Biggest winners (largest improvement v1.0.0 to v1.5.0-dev):
Q7's 4.3× improvement is the headline number from this analysis, and it surprised me. A 4.3× speedup from iterative algorithmic improvements alone (no schema changes, no index tricks, same hardware) is unusually large for a query that was already completing successfully.
Regressions
I found no query slower in v1.5.0-dev than in v1.0.0 across the full 22-query TPC-H suite. Adjacent-version regressions do appear (see Analysis section), but the cumulative direction is consistently positive.
Query Category Breakdown
Key finding: Aggregation queries improved the most (65.5%), driven primarily by Q18's dramatic improvement (3.4×). Full-scan queries improved the least (+12.1%): if your workload is dominated by Q1-style full table scans, the cumulative v1.0→v1.5 improvement is real but not a compelling reason to rush an upgrade.
The v1.4 sorting rewrite (PR-17584) measured 1.7-2.7× on random data in isolated benchmarks7, but its TPC-H impact is modest. Using Q3, Q4, Q10, and Q16 as a sorting proxy (the four queries most dominated by ORDER BY):
That's expected: TPC-H sorting queries are multi-join queries where ORDER BY is one component, not isolated sorts where the rewrite's full gains apply.
v1.4.4 to v1.5.0-dev: Per-Query Deltas
Query-level movement from v1.4.4 to v1.5.0-dev is mixed but net-positive. The most-moved queries (both directions):
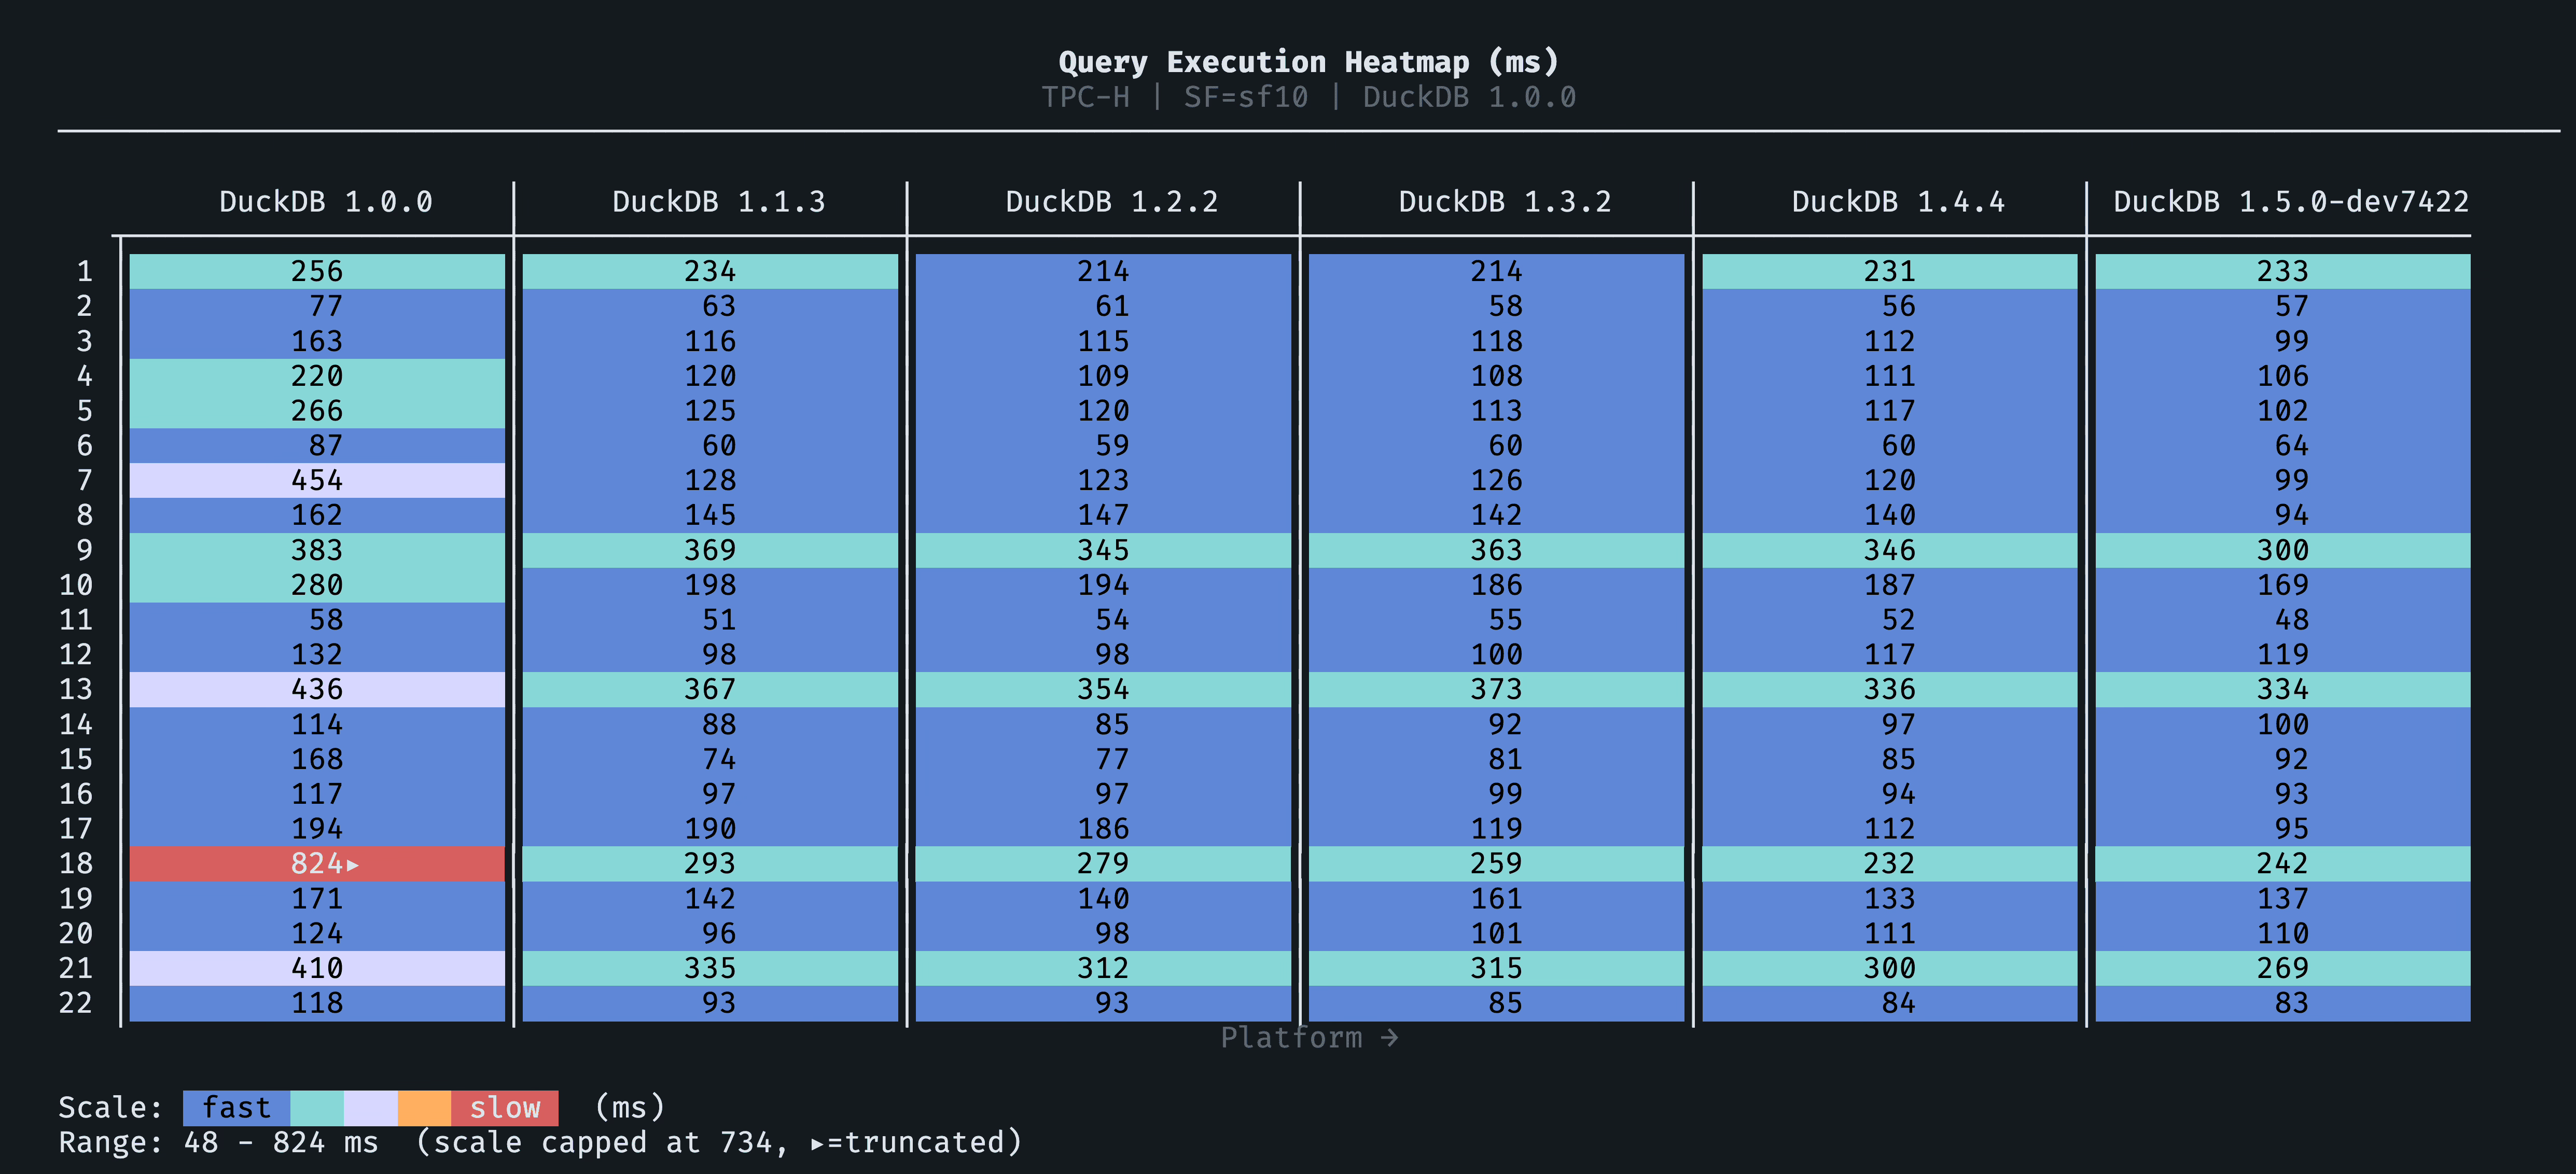
The full six-version heatmap shows the cumulative per-query trajectory. Darker cells are faster; look for the v1.1 row (the biggest single jump) and the Q7/Q18 columns (the steepest per-query improvement over the full range):
Results: TPC-DS (SF=10)
TPC-DS has 99 queries (run as 103 individual variants), testing window functions, CTEs, correlated subqueries, and other advanced SQL features that TPC-H doesn't cover.
Overall Version Progression
TPC-DS Power Score (Power@Size):
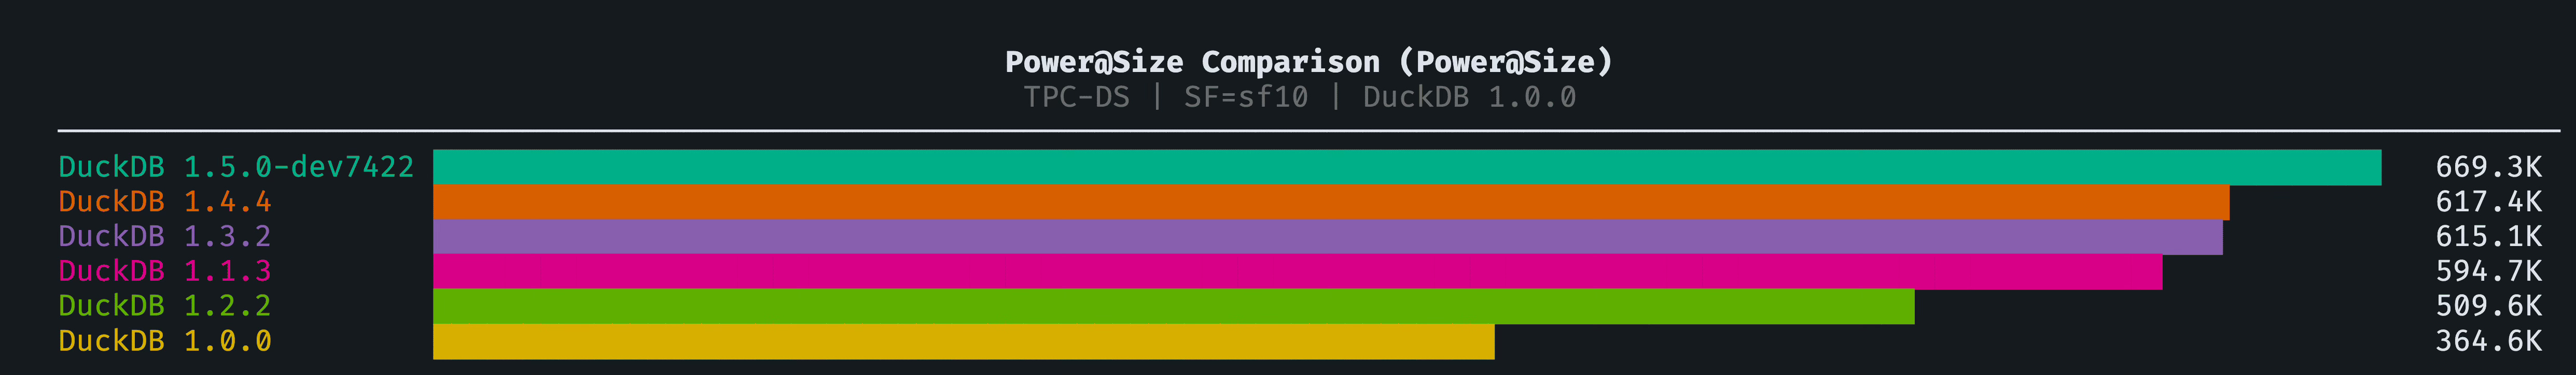
v1.2.2 Dip: Power@Size dropped 16% from v1.1.3 before recovering in v1.3.2. The largest regression was Query 22, a GROUP BY ROLLUP over inventory data, which went from 881ms to 10,032ms, an 11× slowdown. Queries 67, 23A, 14A, 49, and 27 also regressed (43-136%). By v1.3.2, overall TPC-DS Power@Size exceeded v1.1.3 levels. But Q22 itself never came back. My plan/profiling evidence supports two compounding causes: details in the Q22 deep-dive below.
In my matrix summary artifacts, v1.0.0 shows 308/309 query records passed while v1.1.3+ shows 309/309; all versions report zero timeouts. Across versions, the dominant change is execution speed, not broad query-correctness drift.
The v1.2 Regression: What Happened to Query 22?
TPC-DS Query 22 runs a four-column GROUP BY ROLLUP over inventory, one of the largest tables in the schema. ROLLUP expands to five grouping sets: the full combination plus four progressively coarser subtotals. It's one of the most aggregation-intensive queries in TPC-DS, and it's where the v1.2 regression hit hardest.
The strongest hypothesis from plan/profiling evidence is two independent changes that compound against each other.
v1.2: hash aggregation rework
Between v1.1.3 and v1.2.0, DuckDB made hash aggregation performance improvements (PR-15251, PR-15321) targeting high-cardinality single-group-set workloads. These changes added row-width-aware partitioning thresholds and a "skip lookups if mostly unique" heuristic, both good for single-GROUP-BY queries, both bad for
ROLLUP.ROLLUPproduces NULL-padded rows across multiple grouping sets, which inflates the apparent uniqueness rate and triggers wider partitioning for the wider tuples. On Q22, this created a perfect storm: high base cardinality × five grouping sets × heuristics tuned for a different data pattern.v1.3: one step forward, one step back
DuckDB v1.3.0 added HyperLogLog-based adaptive hash table sizing (PR-17236), which improves hash table cardinality estimates. DuckDB's own benchmarks showed TPC-DS Q67, another
ROLLUPquery, running ~2× faster with this optimization. But the same release also added a correctness fix (PR-17259) that disabled all column pruning belowROLLUPandCUBEoperators. Instead of scanning the twoinventorycolumns Q22 actually needs it scanned all of them8.
These two forces (fixed hash tables, broken column pruning) net out to ~50% slower than the v1.1.3 baseline. An improved column pruning fix landed in PR-20781, which re-enabled column pruning while keeping a targeted guard only in RemoveDuplicateGroups. That fix ships with v1.5.0 GA. When it does, Q22 should return toward its v1.1.3 speed, or better. To my knowledge, this is the only public, per-query, multi-version TPC-DS benchmark of DuckDB; if you've seen another, I'd like to know about it.
Results: ClickBench
ClickBench tests scan-heavy web analytics patterns on a single 100M-row table.
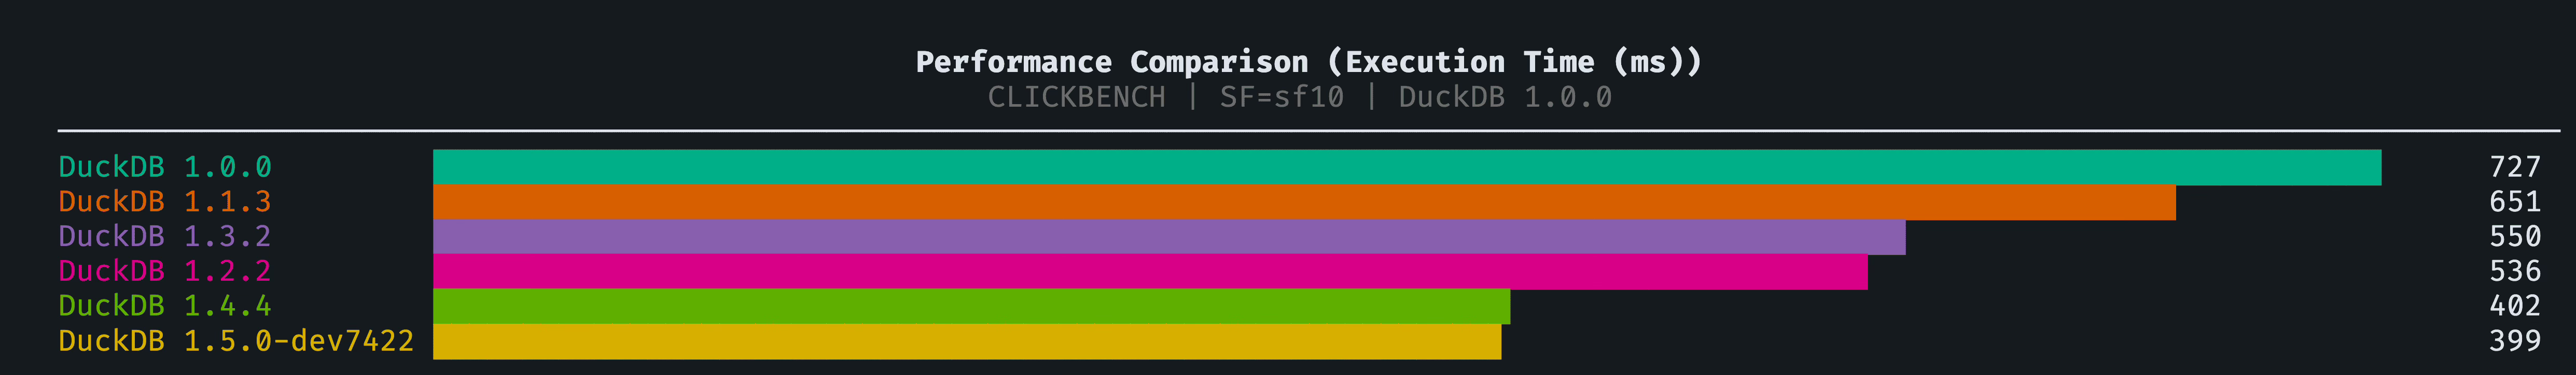
Overall Version Progression
ClickBench Total Runtime (ms):
Note that v1.3.2 shows a slight regression vs. v1.2.2 in total ClickBench runtime (555ms vs 536ms). Given observed ClickBench variance in this matrix, I treat this as directional rather than a strong signal.
Query Pattern Analysis
ClickBench queries are categorized by pattern:
Key finding: String matching (LIKE) is the biggest winner at 73.2%, and high-cardinality GROUP BY improved more than low-cardinality (42.5% vs 29.7%). String hash caching (PR-18580) is the most direct match for the LIKE gains: string processing changes have an obvious path to LIKE query performance. Dictionary-aware insertion (PR-15152) and fewer aggregation allocations (PR-16849) align with the high-cardinality GROUP BY gains concentrated in v1.2-v1.3. Higher-load-factor probing (PR-17718) fits the continued ORDER BY improvement through v1.4. I haven't run micro-benchmarks to isolate each contribution, but the per-pattern distribution matches the change history well.
Results: SSB (SF=10)
The Star Schema Benchmark tests classic dimensional model queries.
Overall Version Progression
SSB Total Runtime (ms):
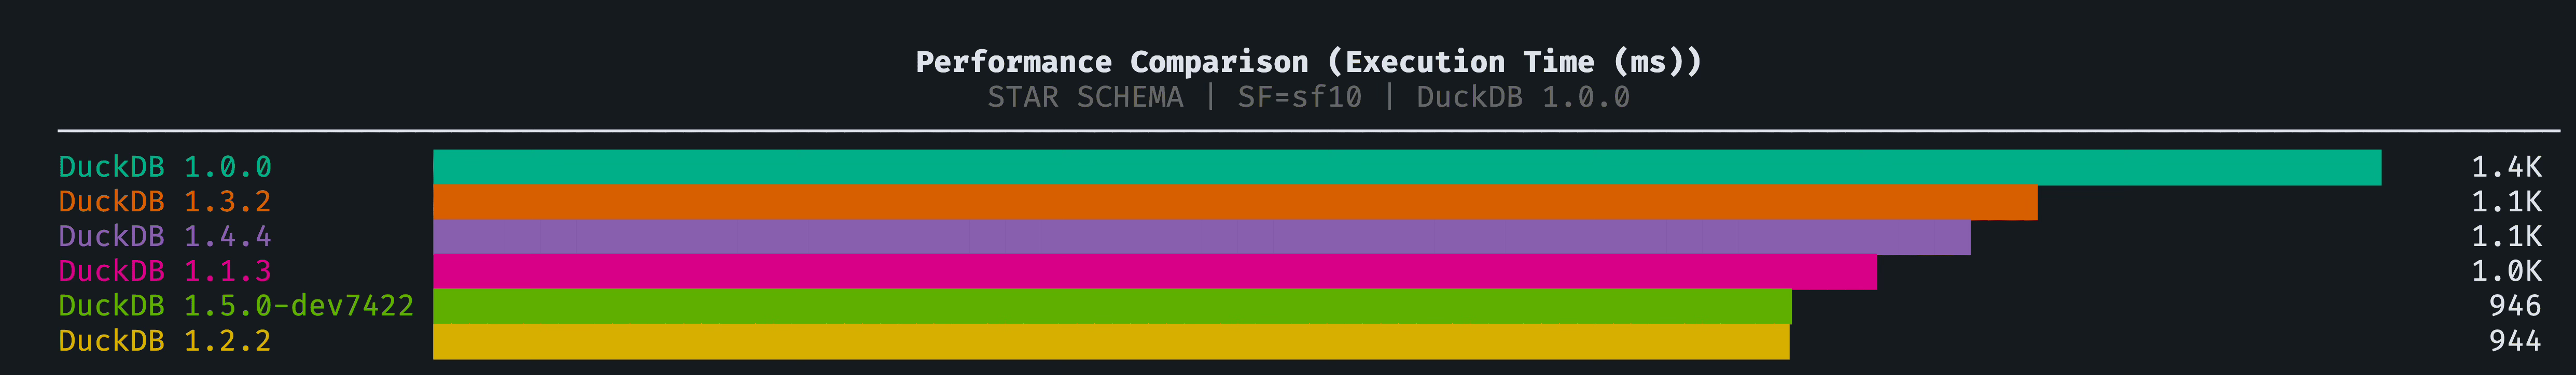
The per-query heatmap makes the uneven progression visible. v1.1/v1.2 show broad improvement (bluer cells), v1.3/v1.4 regress on Flight 3-4 joins (warmer cells), and v1.5 recovers to the best result across most queries:
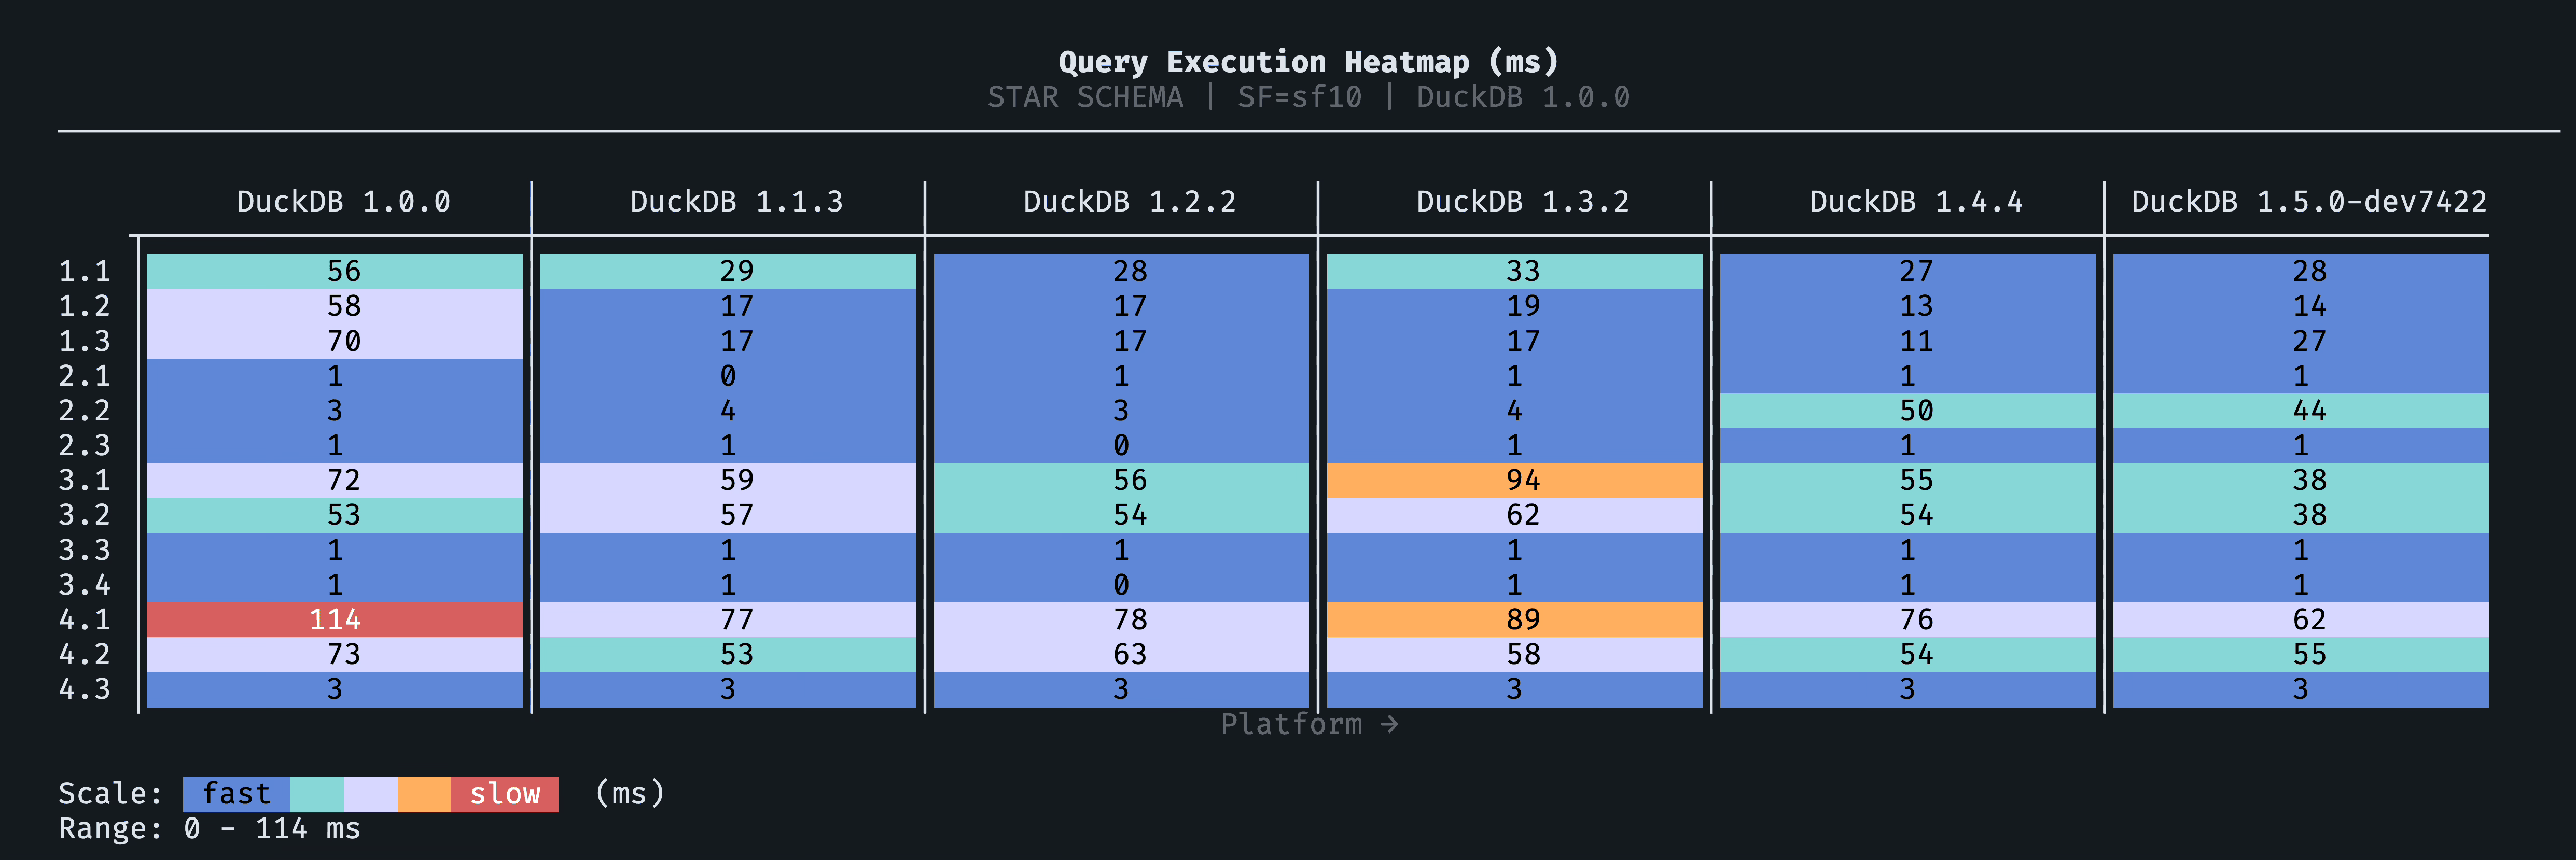
SSB is the one benchmark where improvement isn't consistent across every version. v1.3.2 and v1.4.4 are both slower than v1.1.3/v1.2.2, but v1.5.0-dev fully recovers and is the fastest version overall (938ms vs 1,005ms for v1.1.3). Per-subquery plan and profiling diffs show that the v1.3/v1.4 slowdown is concentrated in specific Flight 3-4 join queries rather than spread evenly.
One outlier worth noting: Q2.2 jumps from 4ms to 53ms in v1.4.4 (and 44ms in v1.5.0-dev), a large percentage regression but small in absolute terms. Because Q2.2 contributes <50ms to total runtime in every version, the Flight 3-4 joins are where the macro story plays out:
The persistent regression is mostly Flights 3 and 4, especially Q4.1 and Q4.2:
I traced the SSB slowdown to a two-stage execution story, similar to the Q22 analysis approach.
Stage 1, v1.2.2 -> v1.3.2/v1.4.4: regression without plan-shape change
For representative regressors (
Q3.2,Q4.1), theEXPLAINplans keep the same join skeleton, join predicates, and lineorder full-scan shape across v1.2.2, v1.3.2, and v1.4.4. That makes a structural join-plan rewrite an unlikely primary cause for this regression pattern, including PR #16443 as the dominant driver here.Stage 2, v1.4.4 -> v1.5.0-dev: targeted recovery from scan-time filtering
In v1.5.0-dev,
EXPLAIN ANALYZEforQ3.2andQ4.1showsDynamic Filterson lineorder scan keys, consistent with the Bloom/SIP work in PR #19502. This aligns with the strong recovery inQ3.1andQ3.2, and partial recovery inQ4.1.
The scan-time filtering recovery is strong enough that total SSB runtime in v1.5.0-dev (938ms) beats the previous best (v1.1.3 at 1,005ms). Q4.2 remains slightly slower than v1.2.2, but the gains in Flight 1 and Flight 3 queries more than compensate.
Analysis and Insights
Regression Analysis
Suite-level improvements don't tell the whole story. Optimizations for one pattern can regress another, and the per-query data shows where.
Adjacent-version TPC-H regressions (>10% slower):
All three are adjacent-version regressions; none accumulate to v1.5.0-dev, where every TPC-H query is faster or equal to v1.0.0.
How I Ran These Benchmarks
All benchmarks used BenchBox for reproducibility.
Environment details:
Hardware: Mac Mini (M4, 10 cores, 16 GB unified memory)
OS captured in benchmark artifacts: Darwin 25.3.0
Python runtime: 3.10.17
BenchBox CLI version in this environment: 0.1.3
DuckDB config:
threads=10,memory_limit='12GB',enable_progress_bar=false,result_cache_enabled=false
Run protocol:
Data generation ran once per benchmark.
Load phase ran once per version and benchmark.
Power phase ran 3 times per version and benchmark; median reported in all tables.
No explicit OS page-cache flush between power runs, so measurements reflect warm filesystem cache behavior with DuckDB result cache disabled.
Aggregation method: BenchBox computes per-run per-query medians and per-run Power@Size. I report the median of three runs for each published metric (per-query time, total runtime, Power@Size). I do not recompute Power@Size from cross-run per-query medians.
Representative commands:
# TPC-H SF=10
uv run benchbox run --platform duckdb \
  --benchmark tpch --scale 10 \
  --phases generate,load,power \
  --output results/duckdb-v150dev-tpch-sf10
Each version was tested using isolated Python environments:
uv pip install duckdb==1.0.0  # Baseline
uv pip install duckdb==1.1.3  # Last v1.1
uv pip install duckdb==1.2.2  # Last v1.2
uv pip install duckdb==1.3.2  # Last v1.3
uv pip install duckdb==1.4.4  # Current LTS
uv pip install duckdb==1.5.0.dev311  # Pre-GA v1.5 dev build
Three runs per benchmark per version, median reported.
Run-to-run spread (max within-version spread across the matrix, non-zero power runtimes): TPC-H 2.7%, TPC-DS 72.7%, ClickBench 54.1%, SSB 13.0%. TPC-DS v1.0.0 is the primary outlier (one run at 734s vs median 441s), and ClickBench v1.1.3 had one anomalous run at 999ms vs median 651ms.
Interpretation threshold used in this post:
<2%runtime deltas are directional unless variance is low for that suite/version.>5%shifts are treated as stronger signals when also visible in per-query tables.
Reproducibility artifacts:
Conclusions: v1.0.0 to v1.5.0-dev
Cumulative improvement is real: 1.67× TPC-H, 1.73× TPC-DS, 1.84× ClickBench, 1.45× SSB
Major rewrites delivered: v1.1 lifted TPC-H Power@Size by 39%; overall I/O and runtime improvements reduced ClickBench runtime 46%
Regressions are contained: Regressions exist but are modest (11-17%) and don't accumulate. No TPC-H query is slower in v1.5.0-dev than v1.0.0.
Workload differences matter: SSB regressed in v1.3/v1.4, but v1.5.0-dev fully recovers to the best result overall (1.45×)
Open source enables attribution: specific PRs can be mapped to specific benchmark shifts, which is rare in database benchmarking
The bottom line: upgrade. DuckDB has earned your trust and, if you're on older versions, you're likely leaving meaningful performance on the table. In this matrix, v1.5.0-dev improves runtime by 40.0% on TPC-H, 45.7% on ClickBench, and 30.8% on SSB versus v1.0.0, with a 73.5% higher TPC-DS Power@Size score. v1.4.4 is the safe GA choice today. v1.5.0 ships March 2, 2026; run your critical queries against the pre-release build now so you know what to expect before upgrading.
Limitations and Caveats
Direct evidence is cited inline. Plausible hypotheses are explicitly noted as such.
This uses a pre-GA DuckDB 1.5 build (
1.5.0.dev311), so final GA behavior may differ.Results are from one hardware profile and may not extrapolate to x86 server environments.
Power-phase timings were collected without forced OS cache eviction, so this is a warm-cache profile.
TPC-DS v1.0.0 shows high run-to-run variance (one run at 734s vs median 441s), driven by Q23A/Q23B instability.
Later versions are stable (<5% spread). Median aggregation absorbs these outliers.
References & Resources
Footnotes
This post is part of the DuckDB Performance series at Oxbow Research. I track DuckDB's evolution with systematic benchmarks and technical analysis across each release.
Faster Ducks - MotherDuck Blog, 2025. Performance analysis of DuckDB evolution.
Announcing DuckDB 1.1.0 "Eatoni" - DuckDB Blog, September 2024.
Announcing DuckDB 1.2.0 "Histrionicus" - DuckDB Blog, February 2025.
Announcing DuckDB 1.3.0 "Ossivalis" - DuckDB Blog, May 2025.
Announcing DuckDB 1.4.0 "Andium" - DuckDB Blog, September 2025.
DuckDB Release Calendar and DuckDB GitHub Releases - accessed February 25, 2026. Release calendar lists 1.5.0 as upcoming on March 2, 2026; latest GA listed in releases is v1.4.4 (January 26, 2026).
Redesigning DuckDB's Sort, Again - DuckDB Blog, September 2025. Benchmarks on M1 Max MacBook Pro (10 cores, 64 GB RAM): 1.7-2.7× on random data, up to 10× on pre-sorted data, with wide-table sorting 2-3.4× faster at SF10-SF100.
The column pruning issue under ROLLUP/CUBE was independently documented by GitHub user heldeo, who measured 9.3× more columns scanned on TPC-DS Q36 (another ROLLUP query) when running on S3-backed Parquet. See Column pruning disabled for GROUP BY ROLLUP/CUBE/GROUPING SETS. The underlying correctness fix was PR-17259; the targeted performance fix is PR-20781, shipping in v1.5.0.